A Table of Numbers or a Picture of Possibilities?
Compare a probability table and branching diagram for a small hypothetical game, then use a week of short exercises to choose the clearer model.
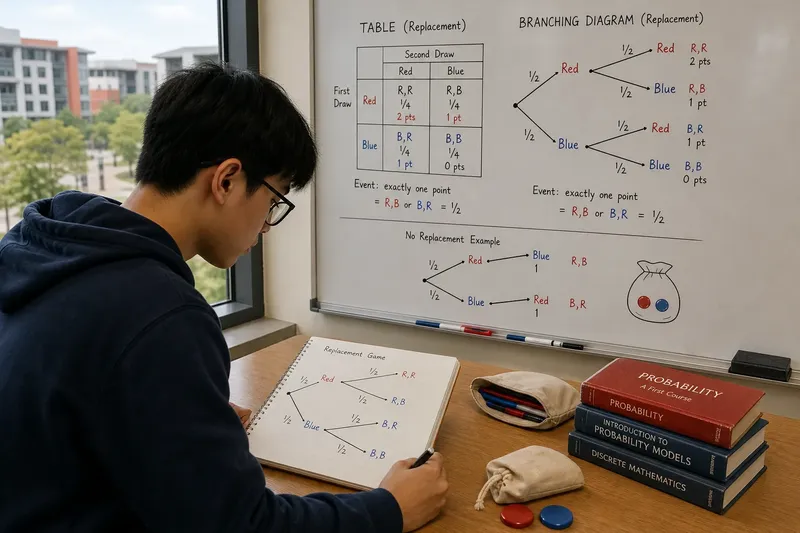
At USTH, a student sketching a toy casino game can reach the same probability by two routes: a table of outcomes or a branching diagram. The probability table vs. branching diagram choice is less about which is correct and more about which makes the next question easier to answer.
Consider a small, invented game: a player draws one token from a bag, replaces it, then draws again. The bag contains a red token and a blue token. A red draw earns a point; a blue draw earns none. The exercise is deliberately modest. Its purpose is to make the structure visible, not to imitate a real casino product.
A table puts outcomes and their probabilities in rows and columns. A branching diagram shows choices unfolding from one draw to the next. Think of the table as a labeled drawer: useful for finding a particular item. The diagram is more like a set of paths on a map: useful for seeing how one choice leads to another.
What does the table make easy to see?
For two draws, a table can list the ordered pairs of colors: red-red, red-blue, blue-red, and blue-blue. Because the token is replaced, each draw has the same two possible results. If the draws are treated as equally likely, each pair has the same probability.
A compact version can show the first draw along the rows and the second along the columns:
- Red on the first draw, red on the second: one point on each draw.
- Red, then blue: one point, then none.
- Blue, then red: none, then one point.
- Blue, then blue: no points.
This layout is handy when the question concerns a final category. To ask, “What is the chance of exactly one point?” scan for the two rows of information that fit: red-blue and blue-red. The table makes comparison and counting straightforward, especially when a reader wants to group outcomes by a shared feature.
It also separates the outcome from the event being counted. “Red-blue” is an outcome sequence; “exactly one point” is an event that includes more than one sequence. That distinction matters in probability. A table can keep the individual cases in view while allowing them to be grouped for a particular question.
Tables are less expressive about order of dependence. In this game, replacement means the second draw does not depend on the first. In a different invented game where the first token stays out of the bag, the probability of the second draw changes. A table can record that change, but the reason for it may take extra labels or notes.
What does a branching diagram reveal?
A branching diagram begins with a starting point. From it, draw one branch for red and another for blue. From each branch, draw the possible result of the second draw. Label the branches with their probabilities, then label each endpoint with the full outcome.
For the replacement game, the second pair of branches looks the same after either first result. That repeated shape tells the reader something important: the second draw has the same options and probabilities regardless of the first. The diagram makes the sequence of choices visible without requiring a paragraph to explain it.
To find the probability of a particular path, multiply the probabilities along that path. To find the probability of an event made up of separate paths, add the path probabilities. In the toy game, “exactly one red” corresponds to red-blue or blue-red. The diagram makes those two routes distinct; the table makes them easy to collect in one place.
The diagram is especially useful when probabilities change from one stage to another. Imagine a second invented game in which the first token is not replaced. After a red draw, only the blue token remains; after a blue draw, only red remains. The branches from the two first outcomes then differ. That difference is visible at a glance, while a table may need an added note to clarify why the cases have different probabilities.
There is a cost. Each new stage adds branches. A diagram that is clear for two draws can become crowded as the sequence grows, particularly if each stage has several outcomes. A tree is not automatically clearer because it resembles a tree; diagrams also need pruning, labels, and restraint.
How should you choose between the two?
Start with the question, not the drawing tool. If you need to compare final outcomes or count the cases that meet a condition, a table is often the cleaner choice. If you need to track how earlier results affect later possibilities, begin with a branching diagram.
For a small game, the two forms can check each other. Draw the tree, list its endpoints in a table, and see whether every endpoint appears once. Then compare the probabilities assigned to matching outcomes. This is a useful consistency check, not proof that the assumptions behind the model are sound.
The assumptions deserve their own line. Are all tokens equally likely to be drawn? Is the first token replaced? Does the player receive points for each red token, or only for a particular sequence? The model can only answer the game that its rules describe. If its starting assumptions are vague, a tidy diagram merely makes the vagueness look organized.
Use the table when:
- The possible final outcomes are already known.
- You need to group several outcomes into one event.
- You want to compare counts or probabilities side by side.
Use the branching diagram when:
- The order of events matters.
- A later probability may depend on an earlier result.
- You want to explain how a sequence is built from separate stages.
What should you practice during a week?
A short routine gives each representation a fair trial without turning a toy game into a semester-long monument. Spend a little time each day with the same two-draw game, then change one feature at a time. Keep the rules written beside the work so the model does not quietly drift.
- Monday: state the rules. Write down the contents of the bag, whether a token is replaced, and how points are awarded. List the possible results of one draw before drawing anything.
- Tuesday: make the table. Put the first result in rows and the second in columns. Fill each cell with an outcome sequence and note the event it represents.
- Wednesday: draw the branches. Start from one point, draw both first-draw options, then add the second-draw options. Label each branch with its probability under the stated rules.
- Thursday: answer one question twice. Find the probability of exactly one point using the table, then use the diagram. If the answers differ, check for a missing outcome, a duplicated case, or an incorrect assumption.
- Friday: change replacement. Imagine the first token is not returned. Revise the diagram and table, then mark where the second-draw probabilities changed.
- Saturday: explain the model aloud. Describe which representation helped with the question and why. If the explanation depends on pointing at an unlabeled mark, add a label.
- Sunday: choose by question. Write a new question about the same game. Decide which representation makes it easiest to answer, and give one sentence explaining the choice.
For instance, say a student starts Monday with a rule sheet that mentions two draws but does not say whether the token returns to the bag. The student pauses before assigning probabilities, writes the missing rule as a question, and asks the instructor to clarify the intended toy game. Once the rule is settled, the student draws the tree and builds the matching table. The observable result is a pair of representations based on the same stated assumptions, rather than two neat answers to two different games.
Which questions do learners usually ask?
Does a probability table show the order of outcomes?
It can, if its rows and columns represent successive draws or if each outcome is written as an ordered sequence. A table that records only final totals may hide order, so choose labels that preserve the detail your question needs.
When is a branching diagram better than a table?
It is often easier to read when later possibilities depend on earlier results. The branches show where the options change and which path leads to each endpoint.
Can both representations give the same answer?
Yes, when they encode the same rules, outcomes, and probabilities. If their answers disagree, treat that as a prompt to inspect the model rather than a reason to trust the prettier drawing.
What if the diagram becomes too large?
Use a table or another compact representation once the branches stop clarifying the sequence. You can also draw only the stages relevant to the question, provided you state what has been omitted.
What should stay visible in the finished model?
Keep the rules, the outcomes, and the event being asked about close together. A table without clear headings invites a reader to confuse rows with probabilities. A branching diagram without endpoint labels asks the reader to remember more than the model should require.
For learning probability models at USTH, the useful habit is not loyalty to one format. It is choosing a representation that exposes the part of the game under examination, then checking that the other representation tells the same story where both apply. A small game is enough to practice that judgment; adding ornate graphics is optional, though often tempting.
The probability table vs. branching diagram decision can be made in one plain question: do you need to compare finished cases, or follow how they came about? Keep the answer beside the model. It will help the next reader see not only what the numbers say, but what the numbers were asked to describe.